Overview
Bank of America (BAC) reported better than expected 4Q 2012 earnings last week, reporting $0.03 per share in net income versus expectations of $0.02. This report concluded 2012 for BAC with the company posting $0.25 per share in earnings for the year. However, as is customary with too-big-to-fail banks, the earnings reported was riddled with litigation expenses, non-cash charges, accounting valuation adjustments and the like. The report was solid though, and shows continued progress in BAC's turnaround since the financial crisis. However, the stock was pounded on Thursday and Friday after the report came out, with shares tumbling from $11.80 on Wednesday night to close the week out at $11.14. After the earnings report, is Bank of America a buy?
Earnings Report
As I mentioned, there was a lot of "noise" in BAC's report (as there seemingly always is) and I'd like to highlight the adjustments that were made to net income in the fourth quarter. Note: these are from the press release.
Item
Impact Per Share
Representations and Warranties, Compensatory Fees Settlements with Fannie Mae
(0.16)
Provision for Independent Foreclosure Review Acceleration Agreement
(0.06)
Total Litigation Expense
(0.05)
Negative Valuation Adjustments for Improved Credit Spreads
(0.04)
Provision for Obligations Related to Mortgage Insurance Rescissions
(0.03)
Gain on Sale of Japan Brokerage Joint Venture
0.02
Positive MSR Valuation Adjustment Related to Servicing Sales
0.02
Net Tax Benefit From Recognition of Foreign Tax Credits of Non-U.S. Subsidiaries
0.12
Total
(0.18)
What this table shows is that BAC's 4Q results were negatively impacted by $0.18 per share by these adjustments. This means that without these extra items in the report, BAC's operating results were net income of roughly $0.21 per share, and not the $0.03 that was reported. The details of these valuation adjustments are available in the press release so I won't rehash them here, but the point is BAC's operating results were much stronger than the headline EPS number might suggest.
In addition, BAC's net interest margin was strong for the quarter, moving up from 2.32% in the third quarter to 2.35% in the fourth quarter. While this is lower than 4Q 2011's number of 2.45%, it shows sequential improvement in BAC's ability to collect the spread on credit the company extends. As a result, net interest income moved up quarter-over-quarter from $10.2 billion to $10.6 billion. Again, this is a strong result and reflects BAC's continued turnaround efforts.
Valuation
Given BAC's report and current price of $11.14, is BAC a buy? To answer this, we'll first take a look at a DCF type analysis to determine what we can expect from BAC earnings in the coming years and also some relevant metrics for the stock. First, with any DCF type analysis, assumptions need to be made. My assumptions for this model are: 1) 2012 EPS came from the press release 2) 2013 and 2014 EPS estimates and five year growth estimates are from Yahoo Finance analyst compilations 3) I roughly estimated dividends through 2018; this is an area of opacity for me due to BAC's capital return restrictions from regulators 4) discount rate is 9% (my number) 5) perpetual growth rate is 2% (my number). As always, you may not agree with the efficacy of some or all of my assumptions but any DCF type analysis is subject to conjecture.
2012
2013
2014
2015
2016
2017
2018
Earnings Forecast
Reported earnings per share
$0.25
$0.97
$1.26
$1.43
$1.62
$1.84
x(1+Forecasted earnings growth)
288.00%
29.90%
13.50%
13.50%
13.50%
13.50%
=Forecasted earnings per share
$0.97
$1.26
$1.43
$1.62
$1.84
$2.09
Equity Book Value Forecasts
Equity book value at beginning of year
$20.24
$21.17
$22.39
$23.62
$24.99
$26.54
Earnings per share
$0.97
$1.26
$1.43
$1.62
$1.84
$2.09
-Dividends per share
$0.04
$0.04
$0.04
$0.20
$0.25
$0.30
$0.50
=Equity book value at end of year
$20.24
$21.17
$22.39
$23.62
$24.99
$26.54
$28.13
Abnormal earnings
Equity book value at begin of year
$20.24
$21.17
$22.39
$23.62
$24.99
$26.54
x Equity cost of capital
9.00%
9.00%
9.00%
9.00%
9.00%
9.00%
9.00%
=Normal earnings
$1.82
$1.91
$2.02
$2.13
$2.25
$2.39
Forecasted EPS
$0.97
$1.26
$1.43
$1.62
$1.84
$2.09
-Normal earnings
$1.82
$1.91
$2.02
$2.13
$2.25
$2.39
=Abnormal earnings
-$0.85
-$0.65
-$0.58
-$0.50
-$0.41
-$0.30
Valuation
Future abnormal earnings
-$0.85
-$0.65
-$0.58
-$0.50
-$0.41
-$0.30
x discount factor(0.09)
0.917
0.842
0.772
0.708
0.650
0.596
=Abnormal earnings disc to present
-$0.78
-$0.54
-$0.45
-$0.36
-$0.26
-$0.18
Abnormal earnings in year +6
-$0.30
Assumed long-term growth rate
2.00%
Value of terminal year
-$4.25
Estimated share price
Sum of discounted AE over horizon
-$2.40
+PV of terminal year AE
-$2.53
=PV of all AE
-$4.93
+Current equity book value
$20.24
=Estimated current share price
$15.31
My model suggests BAC is currently worth north of $15 per share, given current expectations. I believe these expectations will ultimately prove to be conservative, but this model highlights the fact that BAC has a long way to go before it is creating economic value added with its assets. Bank of America's asset base is so huge that it can be difficult to ensure the entire asset base is profitable. I believe we are seeing some of that with BAC and that is also why CEO Brian Moynihan has been divesting non-core assets in an attempt to raise return on assets again. Obviously, there are risks to my forecasts but I believe that an intrinsic value of $15.31 per share offers a great margin of safety at current levels in the low $11 range.
Metrics
Let's take a look at a few metrics for BAC now in historical contexts to see where the company has been and where it might go from here.
This first chart is book value per share for BAC. What we see is a rapid climb in the middle of the last decade from roughly $16 per share to over $32 per share just before the financial crisis. We then see a waterfall decline into the low 20's, finally settling at $20.24 today.
(click to enlarge)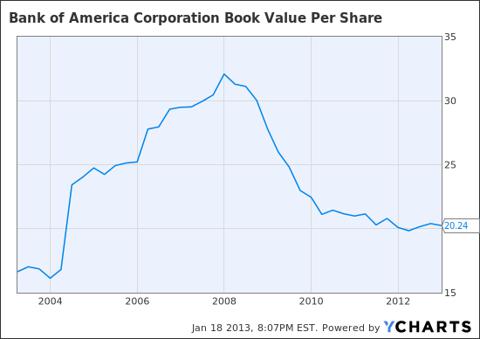
While this chart is ugly, the encouraging thing for longs is that BV/share has stabilized around $20 for a couple of years now, meaning that the nasty decline is likely over, setting the stage for a rebound in the future.
Next, this chart depicts nominal book value. This is the same number except we are not depicting it per share, just the nominal value. This is quite a different chart than the per share number, as we can see that book value has been in a range of $200B to $220B for the past three years or so. This is great, right?
(click to enlarge)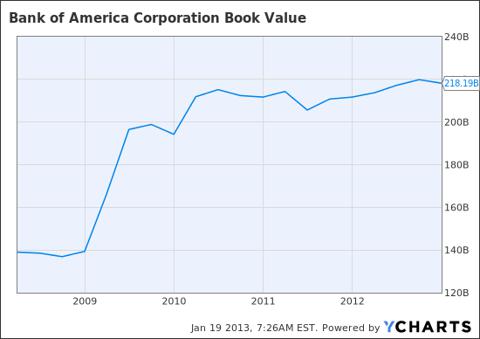
The answer is yes, it is great, except for the fact that BAC was massively diluted during the financial crisis. The results of this are shown below in the chart of nominal book value versus book value per share.
(click to enlarge)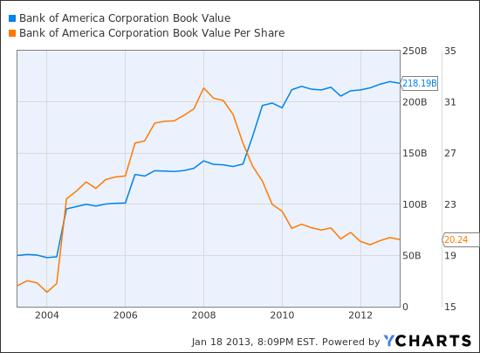
What we see here is that book value per share actually rose much more quickly during the middle part of the 2000's than nominal book value did, but then the financial crisis hit and massive dilution took its toll on BAC's per share book value. The reason I highlighted this is because in the future, when BAC is once again permitted to return capital to shareholders, buybacks will undoubtedly be part of the capital return program and the large divergence we have seen between BV and BV/share will likely close. This will serve to buoy the share and increase their intrinsic value.
Next, I'd like to highlight BAC's debt to equity ratio. One thing CEO Moynihan has been working tirelessly to accomplish is lowering BAC's risks and the chart below shows that his efforts are coming to fruition.
(click to enlarge)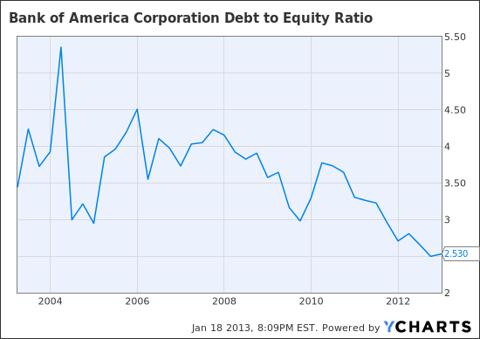
Pre-financial crisis, BAC was in the 3 to 5 range of debt to equity. Now, the company is solidly below three and trending lower. This has two affects for shareholders: 1) less risk as less debt needs to be serviced by operating cash flow 2) potentially less returns as there is less leverage in the business model. I believe this is a positive for BAC shareholders as management has proven the company can make money without leveraging up to pre-crisis levels. Leverage is part of the reason BAC needed a bailout during the crisis and I believe management has learned from this experience and will not repeat it.
So, if there is less debt available to finance credit extensions, the money must come from equity. This would imply that we need to see an increasing return on equity in order to ensure that turnaround efforts are succeeding.
(click to enlarge)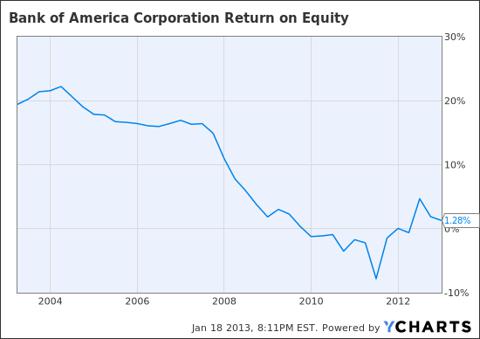
It just so happens that this is exactly what we see in BAC's return on equity chart. We see pre-crisis levels of return on equity of roughly 17% to 22%. I believe these high numbers reflected the fact that BAC was leveraged on debt during that period and the implication is that since BAC was so leveraged, net income on the smaller equity-financed portion of the balance sheet was juiced. This resulted in inflated ROE numbers that I do not believe we will see again from BAC. However, the chart is instructive in that if BAC can return to ROE of 10% or so, huge returns are in store for BAC shareholders. With a steady and growing $236B in shareholders' equity currently, 10% ROE in the future implies roughly $23B in net income for shareholders, or roughly $2 per share. I'm not delusional enough to think that $2 in EPS is coming soon for BAC, but I certainly think it is possible in the next few years, given my confidence in Moynihan.
Taking a look at one final key banking metric, we see that BAC's return on assets chart is about as ugly as book value per share. However, there are some bright spots.
(click to enlarge)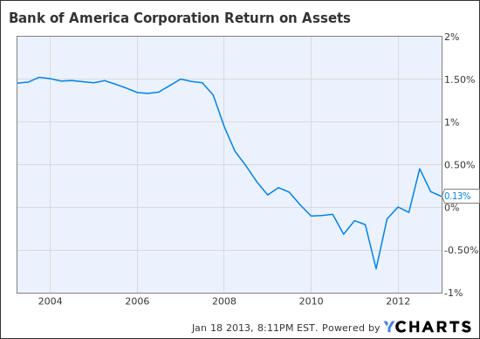
First, we see that ROA has rebounded from the financial crisis lows of less than negative 0.5% to just over the zero line today. While this isn't great, it reflects the ongoing turnaround efforts of BAC management and the fact that BAC has a positive ROA value is nearly cause for celebration in itself. The implication of this chart is that, if BAC can return to levels of profitability where it is making 1% on assets again, shares are extremely undervalued at current levels. Again, I don't think we'll see 1.5% ROA for BAC again given the operating environment and increased regulatory scrutiny, but I think 1% is very reasonable as a longer term goal.
What does 1% ROA imply for earnings? Given BAC's current $2.21T asset base, 1% ROA implies potential net income of roughly $22 billion. This is in line with our discussion of ROE metrics as well. The point is, BAC has enormous untapped earnings potential if it can get back to even two-thirds of its former earning power based on ROA.
Conclusion
Bank of America has many challenges left to face in the coming years given the competitive environment that has sprung out of zero interest rate policies and increased regulatory scrutiny. However, BAC has enormous untapped potential in its asset base and CEO Moynihan and his team have been tirelessly reducing risk and leverage, divesting non-core assets in an attempt to return BAC to its former earnings power. If you want to be long BAC, you must be a long-term holder as this turnaround is not a one or two quarter story. This story will play out over a few years but I believe shareholders who ride it out will be generously rewarded.
Disclosure: I have no positions in any stocks mentioned, but may initiate a long position in BAC over the next 72 hours. I wrote this article myself, and it expresses my own opinions. I am not receiving compensation for it (other than from Seeking Alpha). I have no business relationship with any company whose stock is mentioned in this article. (More...)
This article was sent to 32,446 people who get email alerts on . Get email alerts on » This article was sent to 210,940 people who get the Investing Ideas newsletter. Get the Investing Ideas newsletter » About the author: Josh Arnold I am an independent trader of options and stocks with about six years of experience. I am a recent MBA graduate and I work in the banking sector. I am also studying to sit for the CPA license exam in 2013. Please follow me on Twitter (@JoshArnold1113) and StockTwits (JoshArnold) and check out... More Josh Arnold Articles (22) StockTalks (2) Comments (180) Profile 84 Followers 1 Following Send Message
 Josh Arnold
Stop FollowingJosh Arnold
 Single page view page 1 / 2 | Next » TOP AUTHORS: The Opinion Leaders TOP USERS: StockTalkers | Instabloggers RSS Feeds | Contact Us | About Us | Premium Program Terms of Use | Privacy | Xignite quote data | © 2013 Seeking Alpha Follow @SeekingAlpha
