Overview
Citigroup (C) reported fourth quarter earnings last week of $0.38 per share including charges and accounting adjustments. However, excluding these items, Citi reported almost double that number, $0.69. The report was decent but the stock was hammered on Thursday, dropping about 3%. The report shows Citi's continued progress in its turnaround efforts since the financial crisis and is also the first earnings report of new CEO Michael Corbat.
The quarter was described as a "kitchen sink" quarter wherein new management takes every charge they can in order to get rid of possible negative adjustments to net income in the future. A look through the charges and items adjusting net income confirms this and this action by Corbat paves the way for large gains down the road. This article will take a quick look at the earnings report and attempt to value Citi in its current state to see if shares deserve your capital.
Earnings Release
First, let's take a look at some of the highlights from the earnings report and exclude some of the "noise" inherent in too-big-too-fail banks' reports. Note these are from the press release linked above.
Headline net income reported was $1.2 billion
Litigation charges and related expenses dwarfed net income, coming in at $1.3 billion
Net interest margin increased to 2.93%
Net credit losses of $3.1 billion declined 25%
Loan loss reserve release of $86 million versus $1.5 billion prior
Deposits grew $931 billion versus loan growth of $540 billion
CVA/DVA "loss" of $485 million due to improving credit spreads and debt valuation
In looking through these numbers, there are some positive standouts. First, the headline net income number was nearly doubled by the operating income of the business, reflecting enormous amounts of charges related to various things including litigation and credit spread revaluations. While litigation is seemingly endless these days for large banks, one hopes that the days of $1+ billion litigation charges are numbered for Citi and the other money center banks. Next, net interest margin improved to 2.93%, easily beating Bank of America's (BAC) 2.35% net interest margin reported the same day. Credit quality also improved for Citi, with net credit losses declining to $3.1 billion for the quarter.
Deposits grew in the quarter by almost $1 trillion for Citi and loans grew much slower at $540 billion. The credit spread/debt valuation adjustments totaled $485 million for the quarter, reflecting higher prices for Citi's debt and related credit spreads. This is a very positive development as the rule regarding accounting for a company's debt means "losses" are incurred when the value of a company's debt rises (meaning investors are more willing to hold the debt, believing the company can service it) and "gains" when the value of the company's debt declines. Evidence of this phenomenon was seen during the financial crisis when Citi and other big banks were taking massive "gains" on their income statements due to the value of the company's debt tanking out of investor fear of default. The $485 million is pointless noise and should be ignored as it has nothing to do with the business, but the point to take away is that improving debt valuations of Citi issuances is positive as it reflects investor's improving sentiment regarding the bank's future.
One curious point on the quarter was the loan loss reserve release of only $86 million versus a prior release of $1.5 billion. This was brought up on the call as well, as analysts were confused by this move. Basically, banks can move money they are holding out of loan loss reserves when they feel that the likelihood of loan losses has abated enough that the amount of reserves is too large. This results in a "gain" on the income statement as the liability the money is held aside to pay shrinks. As noted, Citi showed improving credit losses as they declined 25%, but almost nothing was moved out of loan loss reserves. My personal feeling is that Corbat didn't want to use up this valuable asset in his first report as CEO and that the management team wanted to put out one "kitchen sink" quarter, saving this potential windfall for 2013. Therefore, I believe that Citi's results in 2013 will be substantially helped by loan loss reserve requirements shrinking as credit improves among Citi's customers. There is a benefit that has ostensibly accrued already but has not been unlocked by management, but it will be in 2013, providing a windfall for Citi shareholders.
Valuation
Given Citi's report and current price of $41.66, is C a buy? To answer this, we'll first take a look at a DCF type analysis to determine what we can expect from Citi earnings in the coming years and also some relevant metrics for the stock. First, with any DCF type analysis, assumptions need to be made. My assumptions for this model are: 1) 2012 EPS came from the press release 2) 2013 and 2014 EPS estimates and five year growth estimates are from Yahoo Finance analyst compilations 3) I roughly estimated dividends through 2018; this is an area of opacity for me due to Citi's capital return restrictions from regulators 4) discount rate is 9% (my number) 5) perpetual growth rate is 3% (my number). As always, you may not agree with the efficacy of some or all of my assumptions but any DCF type analysis is subject to conjecture.
2012
2013
2014
2015
2016
2017
2018
Earnings Forecast
Reported earnings per share
$2.56
$4.63
$5.20
$5.74
$6.34
$7.00
x(1+Forecasted earnings growth)
80.86%
12.31%
10.44%
10.44%
10.44%
10.44%
=Forecasted earnings per share
$4.63
$5.20
$5.74
$6.34
$7.00
$7.74
Equity Book Value Forecasts
Equity book value at beginning of year
$64.26
$68.85
$73.93
$79.47
$85.47
$91.97
Earnings per share
$4.63
$5.20
$5.74
$6.34
$7.00
$7.74
-Dividends per share
$0.04
$0.04
$0.12
$0.20
$0.35
$0.50
$1.00
=Equity book value at end of year
$64.26
$68.85
$73.93
$79.47
$85.47
$91.97
$98.71
Abnormal earnings
Equity book value at begin of year
$64.26
$68.85
$73.93
$79.47
$85.47
$91.97
x Equity cost of capital
9.00%
9.00%
9.00%
9.00%
9.00%
9.00%
9.00%
=Normal earnings
$5.78
$6.20
$6.65
$7.15
$7.69
$8.28
Forecasted EPS
$4.63
$5.20
$5.74
$6.34
$7.00
$7.74
-Normal earnings
$5.78
$6.20
$6.65
$7.15
$7.69
$8.28
=Abnormal earnings
-$1.15
-$1.00
-$0.91
-$0.81
-$0.69
-$0.54
Valuation
Future abnormal earnings
-$1.15
-$1.00
-$0.91
-$0.81
-$0.69
-$0.54
x discount factor(0.09)
0.917
0.842
0.772
0.708
0.650
0.596
=Abnormal earnings disc to present
-$1.06
-$0.84
-$0.70
-$0.57
-$0.45
-$0.32
Abnormal earnings in year +6
-$0.54
Assumed long-term growth rate
3.00%
Value of terminal year
-$9.02
Estimated share price
Sum of discounted AE over horizon
-$3.62
+PV of terminal year AE
-$5.38
=PV of all AE
-$9.00
+Current equity book value
$64.26
=Estimated current share price
$55.26
What this table suggests is that Citi is worth about $55 per share, according to my assumptions. The implication of this model is that the present value of Citi's earnings for the next five years discounted to the present at a rate of 9% plus the book value of the company is worth about 33% more than the market values the company. As you can also see, the economic value added by Citi management is negative for at least the next five years, according to my model. This reflects the very high book value of the company relative to its earnings potential. This is a problem for all of the big banks right now and will probably persist for the foreseeable future. However, this does not mean that the company is not a buy, as it is clear that Citi's earnings are on the upswing and the company is creating significant value for shareholders.
Metrics
In light of the DCF analysis, let's take a look at some relevant metrics for Citi to see where the company has been over the past several years and some clues as to where it might go from here.
Our first chart is nominal book value for Citi. What we see is that book value has skyrocketed from just under $90B ten years ago to over double that number, coming in at $188B today. We can also see the significant drop during the depths of the financial crisis but much of this value lost was simply accounting adjustments due to revaluations of assets. In any case, those valuations have rebounded and the company is creating book value again.
(click to enlarge)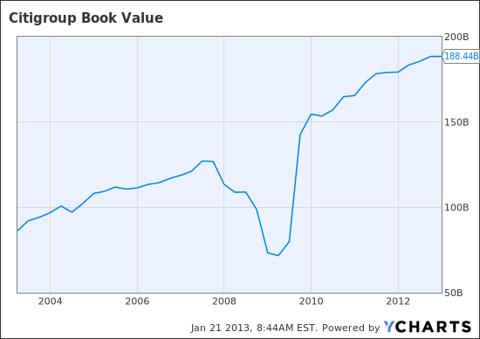
Next, this chart shows book value per share. This is the same as the chart above, except the number is now divided by shares outstanding. What we see is quite the different story than before.
(click to enlarge)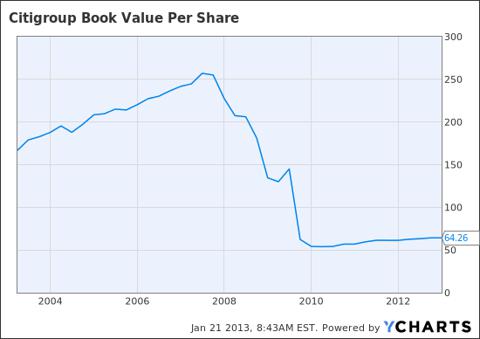
Book value per share should be rising just like nominal book value, but it isn't. Why is this? During the financial crisis, Citi shareholders were subject to the government bailout Citi received and the resulting massive dilution of shareholders destroyed book value per share. We can easily see the affects of this dilution with the waterfall decline in book value per share from a split-adjusted $250+ to $64.26 today.
The divergence of nominal book value and book value per share can be seen more readily in the chart below.
(click to enlarge)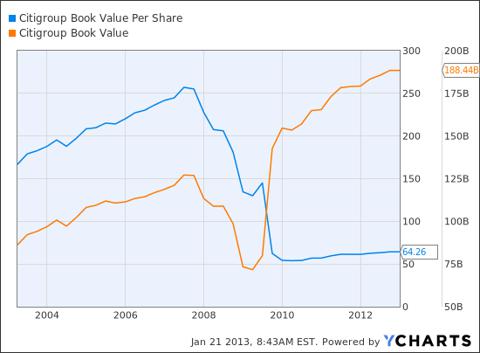
As you can see, nominal BV and BV per share rise in tandem until the financial crisis where there is a violent divergence in the two values. The sunny side of this story is that since such a large divergence occurred, whenever Citi is cleared by regulators to return capital to shareholders, buybacks will undoubtedly be a part of the capital return plan and BV per share should begin to outpace nominal BV's rise again, creating value for shareholders in the process.
Next, it has been clear for some time that Citi has been deleveraging and decreasing the risk it is taking. The chart below depicts this quite clearly.
(click to enlarge)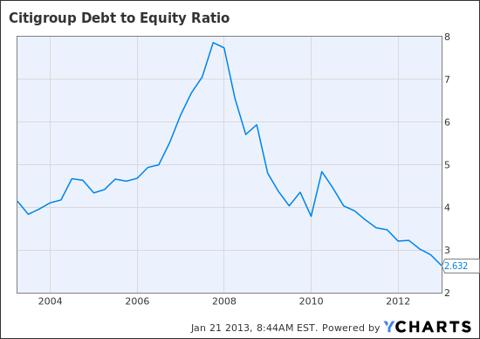
We can see in the debt to equity ratio chart that Citi operated in the 4-5 range of debt to equity before the financial crisis. During the crisis, debt to equity spiked to almost 8, reflecting the declining value of equity in the company and thereby raising the relative value of the debt on its balance sheet. Since the crisis ended, Citi has done a great job deleveraging to a current debt to equity ratio of 2.63. Only Citi management knows what the target debt to equity ratio is but this is great news for shareholders as another 2008-style meltdown becomes increasingly unlikely with debt to equity ratios shrinking like this. The flip side is that less leverage means less potential earnings power but given Citi's epic wealth destruction during the financial crisis, this is a small price to pay.
So what does Citi earn on its equity? As we see below, Citi shareholders were accustomed to 17% to 20% returns on equity pre-crisis. These are numbers that shareholders dream about today and I'm thinking numbers like this aren't possible in the future. The simple math of it is that since debt is taking up a smaller portion on the balance sheet, it invariably means that equity must pick up the slack. This implies that every dollar of subsequent earnings is spread over a larger amount of equity, thereby decreasing the return on equity. Again, given the deleveraging process to reduce risk, this is a small price to pay.
(click to enlarge)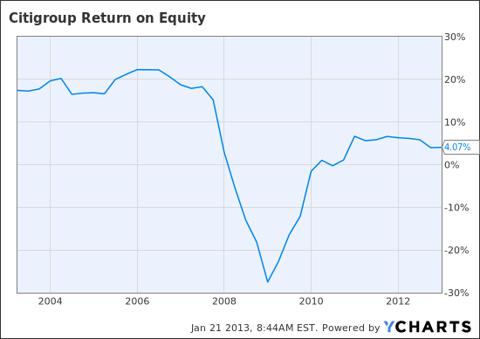
What does this imply for Citi's valuation? If we assume that Citi can, at some point in the future, return to 10% return on equity, it implies earnings power of $19.1B in the future. I believe 10% is a fair target given that this number is roughly half of what the leveraged Citi used to earn. At current equity of $191B, even if Citi only returns to 8% ROE, it implies over $15B of earnings power. Given that Citi currently has 2.93B shares outstanding, EPS of $5.21 to $6.52 should be easily in reach. Given that Citi should easily be assigned an earnings multiple of 10 or higher, a valuation in the $52 to $65 range is effortlessly attainable.
Lastly, a look at Citi's return on assets for the past ten years is instructive. What we see is that Citi's pre-crisis ROA was 1.2% to 1.5%. Since, however, ROA plunged past negative 1% but has since rebounded to sit at 0.39% currently. What does this mean for valuation?
(click to enlarge)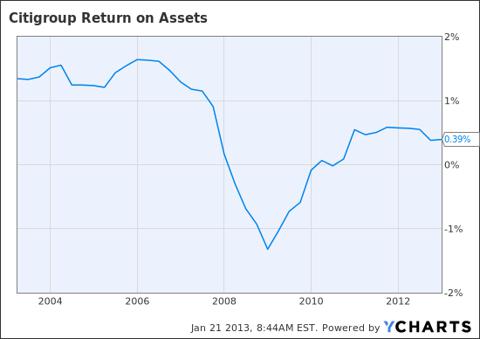
If we assume that Citi can once again earn 1% on its assets, the implication is that Citi has roughly $18.65B of earnings power. At current total assets of $1.865T, even if Citi only reaches 0.8% ROA (which I believe will prove conservative), $14.92B of earnings is implied. This gives an EPS range on these conservative numbers of $5.09 to $6.37. Again, applying a conservative 10 earnings multiple, we arrive at a price of roughly $51 to $64.
Conclusion
Citi has many challenges to face in the coming years given the zero interest rate policy environment and regulatory scrutiny. Returning excess capital to shareholders will be a contentious issue for regulators and shareholders alike, but Citi has an experienced management team with some very powerful earnings tailwinds that have yet to be unlocked. A long position in Citi is not a trade; rather, it is for a long-term investment. However, I believe that shareholders who believe in Corbat and Citi's management will be generously rewarded for holding on.
Disclosure: I have no positions in any stocks mentioned, but may initiate a long position in C over the next 72 hours. I wrote this article myself, and it expresses my own opinions. I am not receiving compensation for it (other than from Seeking Alpha). I have no business relationship with any company whose stock is mentioned in this article. (More...)
This article was sent to 27,918 people who get email alerts on . Get email alerts on » This article was sent to 210,940 people who get the Investing Ideas newsletter. Get the Investing Ideas newsletter » About the author: Josh Arnold I am an independent trader of options and stocks with about six years of experience. I am a recent MBA graduate and I work in the banking sector. I am also studying to sit for the CPA license exam in 2013. Please follow me on Twitter (@JoshArnold1113) and StockTwits (JoshArnold) and check out... More Josh Arnold Articles (21) StockTalks (2) Comments (180) Profile 84 Followers 1 Following Send Message
 Josh Arnold
Stop FollowingJosh Arnold
 Single page view page 1 / 2 | Next » TOP AUTHORS: The Opinion Leaders TOP USERS: StockTalkers | Instabloggers RSS Feeds | Contact Us | About Us | Premium Program Terms of Use | Privacy | Xignite quote data | © 2013 Seeking Alpha Follow @SeekingAlpha
