In this article, we'll examine Honeywell International Inc. (HON). We'll take a look at the risk-return profile. Also, we'll discuss the financial performance of the firm, and we'll take a look at Honeywell from the perspective of a technical analyst. Further, we'll conduct a relative valuation of the Company.
That said, Honeywell is a market leader during this intermediate-term advance, and investors should consider accumulating shares of Honeywell.
First, we'll use descriptive statistics by taking a sample of the population of nominal monthly returns of the Company. At this point, we won't make any statistical inferences. Some of the sample statistics will include the arithmetic time-series mean, and the time-series median. Also, we'll take a look at a histogram of nominal monthly returns. We'll also discuss the absolute frequencies, relative frequencies and cumulative relative frequencies of the return profile. Further, we'll determine the geometric mean return and the modal interval. The sample will consist of monthly returns between January 2000 and January 2013.
Readers should note that the selected sample contains two bull markets and two bear markets. Further, the sample contains both high interest rate and low interest rate environments.
The time-series nominal arithmetic mean monthly return was 0.9 percent. The time-series median monthly nominal return was 1.5 percent.
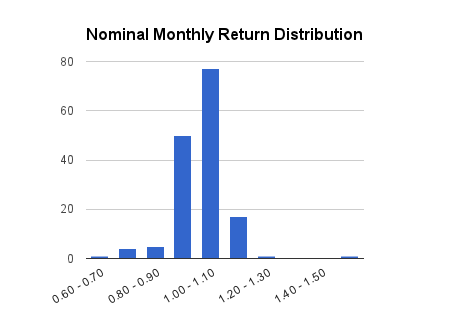
One of the nominal monthly returns was between -40 percent and -30 percent. Four of the nominal monthly returns were between -30 percent and -20 percent. Fifty of the nominal monthly returns were between -10 percent and 0 percent. Seventy-seven of the nominal monthly returns were between 0 percent and 10 percent. Seventeen of the nominal monthly returns were between 10 percent and 20 percent. One of the nominal monthly returns was between 50 percent and 60 percent.
The return of -38 percent occurred during June of 2000, during the bursting of the dot-com bubble. The return of 51 percent occurred during October of 2000.
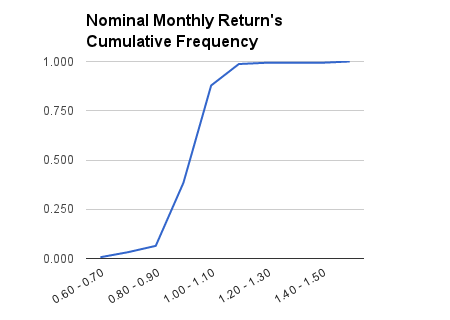
About 32 percent of the nominal monthly returns were between -10 percent and 0 percent. Further, 49.4 percent of the nominal monthly returns were between 0 percent and 10 percent. About 6.4 percent of the nominal monthly returns were between -40 percent and -10 percent. Finally, 10.9 percent of the nominal monthly returns were between 10 percent and 20 percent.
That said, 38.5 percent of the nominal monthly returns were between -40 percent and 0 percent. That means the other 61.5 percent of the nominal monthly returns were 0 percent or higher. The modal interval was 0 percent to 10 percent.
The time-series geometric mean nominal monthly return or time-series nominal monthly compound growth rate was 0.4 percent. The nominal geometric mean monthly return on a bond equivalent basis was 4.8 percent. The nominal geometric mean monthly return on an effective annual yield basis was 4.9 percent.
We'll make a statistical inference about the population geometric mean nominal monthly return. The population geometric mean nominal monthly return at 95 percent confidence, assuming a standard normal distribution, was between 1.9 percent and -1.1 percent.
Honeywell's nominal monthly return distribution was negatively skewed and leptokuric.
Next, we'll compare some of those sample statistics with the sample statistics of the S&P 500 between 2000 and 2012.
The arithmetic time-series mean monthly nominal return on the S&P 500 was 0.1 percent. The time-series median monthly nominal return on the S&P 500 was 1 percent.
The geometric time-series mean nominal monthly return or time-series nominal monthly compound growth rate on the S&P 500 was 0 percent. I'm sure you can calculate the nominal bond equivalent yield and nominal effective annual yield on the S&P 500: It was 0 percent.
The lack of nominal compound growth is because of the secular bear market that the S&P 500 entered in 2000.
Thus, Honeywell outperformed the S&P 500 between 2000 and 2012.
The sample standard deviation of nominal monthly returns on Honeywell was 9.8 percent. The sample standard deviation of monthly returns on the S&P 500 was 5 percent.
Next, we'll compare Honeywell to some of its competitors in the diversified machinery industry.
Honeywell's revenue and net income increased at a nominal compound growth rate of 6 percent between 2003 and 2011. The dividend increased at a 7.8 percent pace.
Honeywell's revenue and income are increasing faster than the share price: the firm is getting cheaper.
Between 2003 and 2011, General Electric's (GE) revenue grew at a nominal compound growth rate of 4.4 percent. Net income declined at a nominal compound rate of 1.1 percent. The dividend declined at a nominal compound rate of 2.9 percent.
Siemens' (SI) revenue increased at a nominal compound growth rate of 3 percent between 2003 and 2011. Net income increased at a 7 percent pace and the dividend increased at a 12 percent pace.
Overall, Honeywell performed the best financially of the three diversified machinery firms. A large portion of Honeywell's revenue growth came from the automation and control solutions operating segment.
General Electric was valued at 15.78 times trailing earnings and 1.53 times trailing sales.
Siemens was valued at 14.56 times trailing earnings and 0.94 times trailing sales.
Honeywell was valued at 22.59 times trailing earnings and 1.40 times trailing sales.
The market is paying a premium for Honeywell's earnings, but on a price-sales basis the firm isn't too expensive. That said, the forward PE ratio is 13.90: that implies almost a 40 percent upside over the next 12 months if Honeywell continues to trade at about 22.5 times trailing earnings.
We'll take a look at a few of the financial ratios using cross-sectional analysis. The current ratio was 1.40 and the quick ratio was 1.06. Debt to equity was 0.61. Also, the dividend yield was 2.42 percent.
Technical Analysis
(click to enlarge)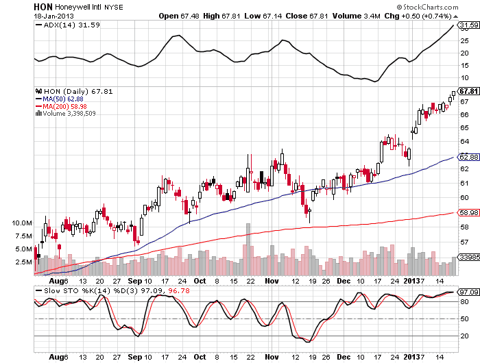
Shares of Honeywell are trading above the rising 50-day simple moving average. The market for shares of the firm is in an intermediate-term up-trend. Also, Honeywell is a market leader. Further, shares are trading above the rising 200-day simple moving average: the primary trend is towards higher prices.
The market for shares of Honeywell is in trending mode as the 14-day slow stochastic indicator is in the overbought zone.
Disclaimer: This article is not meant to establish or continue an investment advisory relationship. Before investing, readers should consult their financial advisor. Christopher Grosvenor does not know your financial situation and ability to bear risk and thus his opinions may not be suitable for all investors.
Disclosure: I have no positions in any stocks mentioned, and no plans to initiate any positions within the next 72 hours. I wrote this article myself, and it expresses my own opinions. I am not receiving compensation for it (other than from Seeking Alpha). I have no business relationship with any company whose stock is mentioned in this article. (More...)
This article was sent to 2,316 people who get email alerts on . Get email alerts on » This article was sent to 210,940 people who get the Investing Ideas newsletter. Get the Investing Ideas newsletter » About the author: Christopher Grosvenor, CMT Chris earned the Chartered Market Technician designation. He is earning the Chartered Financial Analyst designation and graduated with honors in Economics. Also, he has managed money as a professional trader and independently, and continues to do so. Chris utilizes Technical, Financial Analysis... More Company: Grosvenor Research & Analysis Blog: Professional Fundamental & Technical Analysis Christopher Grosvenor, CMT Articles (196) Instablog (178) StockTalks (4) Comments (218) Profile 167 Followers 21 Following Send Message
 Christopher Grosvenor, CMT
Stop FollowingChristopher Grosvenor, CMT
About the author: Visit:Patak Trading Partners
 TOP AUTHORS: The Opinion Leaders TOP USERS: StockTalkers | Instabloggers RSS Feeds | Contact Us | About Us | Premium Program Terms of Use | Privacy | Xignite quote data | © 2013 Seeking Alpha Follow @SeekingAlpha
